#2. Memory Management Demystified - Virtual Memory, Page Faults & Performance
The One Thing to Remember
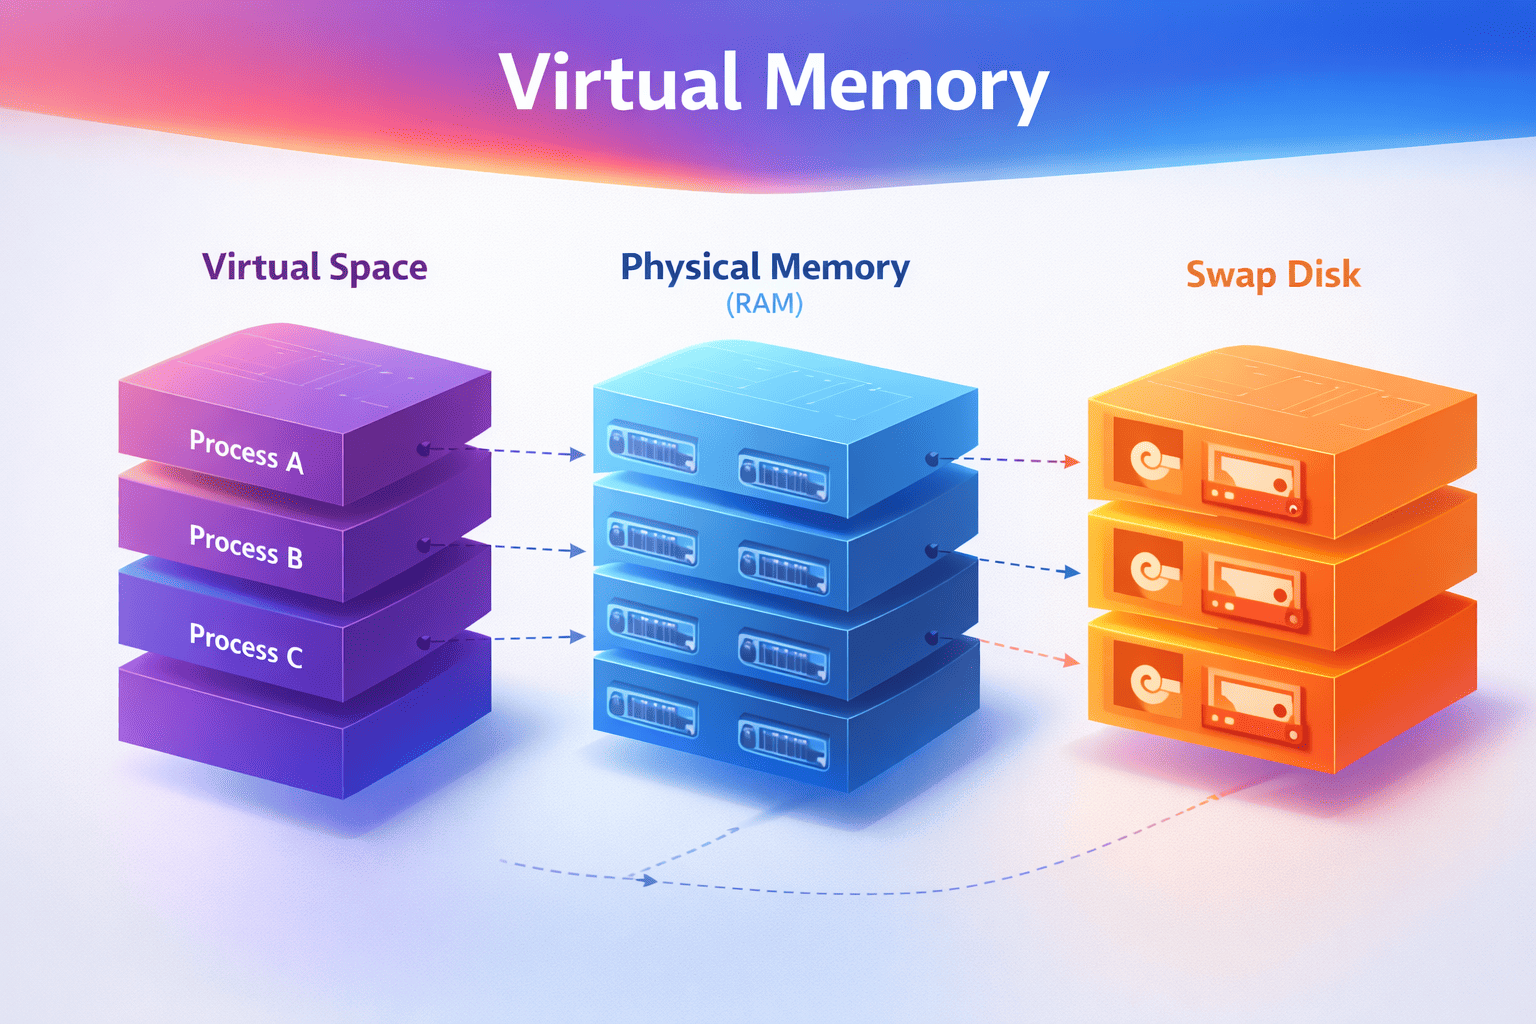
Virtual memory creates the illusion of infinite RAM. Every process thinks it has the entire address space to itself, but the OS juggles physical memory behind the scenes. Understanding this illusion—and when it breaks—is key to writing performant systems.
Building on Article 1
In Article 1: Process vs Thread, you learned that each process gets its own isolated address space—like a house with its own address. But here's the question: How does the OS actually manage all that memory?
Every process thinks it has access to gigabytes of memory, but your server only has so much physical RAM. The OS uses virtual memory to make this work—and when you understand how, you'll finally know why your "2GB process" is only using 100MB of actual RAM.
← Previous: Article 1 - Process vs Thread
Why This Matters (A Production Horror Story)
I once spent 3 days debugging a production issue where a Java service had random 100ms+ latency spikes. The CPU wasn't busy, the database was fine, network was fine. I was stumped.
Then I checked page faults. The process was swapping—cold heap pages were on disk, and when GC touched them, we got major page faults. 100ms delays. The fix? Lock the heap in memory. Two JVM flags. Three days of debugging, two flags to fix it.
This isn't academic knowledge—it's the difference between:
-
Debugging memory issues in minutes vs days
- Understanding virtual vs physical memory = you know what to measure (RSS, not VmSize)
- Not understanding = you throw RAM at the problem, nothing improves
-
Writing efficient code vs accidentally swapping
- Knowing page faults = you avoid touching memory unnecessarily
- Not knowing = your app triggers thousands of page faults, everything slows down
-
Setting correct memory limits
- Understanding RSS vs VmSize = you set limits that actually work
- Not understanding = containers get OOM-killed mysteriously
Memory management knowledge separates engineers who guess from engineers who know.
Quick Win: Check Your Process Memory
Before we dive deeper, let's see what your processes actually use right now:
# See virtual vs physical memory for a process
cat /proc/$(pgrep python | head -1)/status | grep -E "^(VmSize|VmRSS|VmSwap)"

# VmSize: What the process THINKS it has (virtual)
# VmRSS:  What's ACTUALLY in RAM (this matters!)
# VmSwap: What got kicked to disk (should be 0!)

# System-wide memory
free -h
# Look at 'available' - that's what you can actually use
What to look for:
- VmSize >> VmRSS: Process mapped memory but hasn't touched it yet (normal)
- VmSwap > 0: Process is swapping (performance problem!)
- RSS growing over time: Possible memory leak or bloat
The Mental Model (The Hotel Analogy)
I've explained this to hundreds of engineers, and this analogy always works:
The Hotel Analogy
Think of virtual memory like a hotel:
- Guest (Process): Gets a room number (virtual address) - thinks they have rooms 1-1000
- Front Desk (MMU - Memory Management Unit): Translates room numbers to physical locations
- Room Key (Page Table): The mapping of virtual → physical addresses
- Physical Rooms (RAM): Actual memory - limited supply
- Overflow Parking (Swap): Disk storage when hotel is full - slow but keeps system running
Every guest thinks they have exclusive access to rooms 1-1000, but the hotel dynamically assigns actual rooms based on who's checked in. If the hotel is full, some guests' belongings get moved to overflow parking (swap).
Real example: Your Python process can malloc(1GB) instantly—it just gets a room number. But when it actually tries to use that memory, the OS has to find a physical room (or move someone else's stuff to overflow parking). This is why malloc(1GB) returns instantly but accessing it can be slow.
Visual Model: Address Translation
VIRTUAL ADDRESS SPACE (per process)          PHYSICAL RAM
┌─────────────────────┐                      ┌─────────────────────┐
│                     │                      │                     │
│  Stack              │ ─────────────────►   │  Frame 0x1000       │
│  (grows down)       │                      │                     │
│                     │                      ├─────────────────────┤
├─────────────────────┤                      │                     │
│                     │                      │  Frame 0x1001       │
│  (unmapped - hole)  │    NOT MAPPED        │  (another process)  │
│                     │                      │                     │
├─────────────────────┤                      ├─────────────────────┤
│                     │                      │                     │
│  Heap               │ ─────────────────►   │  Frame 0x1002       │
│  (grows up)         │                      │                     │
│                     │                      ├─────────────────────┤
├─────────────────────┤          ┌────────►  │                     │
│  BSS (zero-init)    │ ─────────┘           │  Frame 0x1003       │
├─────────────────────┤                      │  (shared library)   │
│  Data (initialized) │ ─────────────────►   │                     │
├─────────────────────┤                      ├─────────────────────┤
│  Text (code)        │ ─────────────────►   │  Frame 0x1004       │
└─────────────────────┘                      └─────────────────────┘
                                                     │
   PAGE TABLE                                        │
┌────────┬────────────┬───────┐                      ▼
│ Virtual│  Physical  │ Flags │              ┌─────────────────────┐
│ Page   │  Frame     │       │              │                     │
├────────┼────────────┼───────┤              │  DISK (Swap Space)  │
│ 0x7fff │ 0x1000     │ RW-   │              │                     │
│ 0x0040 │ 0x1002     │ RW-   │              │  Swapped out pages  │
│ 0x0001 │ DISK       │ ---   │ ◄── PAGE     │                     │
│ 0x0000 │ 0x1004     │ R-X   │     FAULT!   │                     │
└────────┴────────────┴───────┘              └─────────────────────┘

Key insight: Each process sees its own virtual address space, but the OS
maps these to physical RAM frames (or swap on disk). Multiple processes
can share the same physical frame (like shared libraries).
Quick Jargon Buster
- MMU (Memory Management Unit): Hardware that translates virtual addresses to physical addresses. It's in the CPU.
- Page Table: Data structure mapping virtual pages to physical frames (or disk). The OS maintains this.
- Page: Fixed-size chunk of virtual memory (usually 4KB on Linux)
- Frame: Fixed-size chunk of physical RAM (same size as page)
- Page Fault: When a process accesses a page that's not in RAM. The OS handles this.
- Swap: Disk space used when RAM is full (slow! ~10,000x slower than RAM)
- RSS (Resident Set Size): Actual physical memory a process is using. This is what matters.
- VmSize: Virtual memory size (what process thinks it has). Often misleading.
The Memory Hierarchy: Numbers You Must Know
┌──────────────────────────────────────────────────────────────────┐
│                    MEMORY HIERARCHY                               │
├──────────────────────────────────────────────────────────────────┤
│                                                                  │
│  CPU Registers     │  < 1ns     │  ~KB      │  Fastest           │
│        ▼                                                         │
│  L1 Cache          │  ~1ns      │  32-64KB  │                    │
│        ▼                                                         │
│  L2 Cache          │  ~4ns      │  256KB    │                    │
│        ▼                                                         │
│  L3 Cache          │  ~12ns     │  8-32MB   │                    │
│        ▼                                                         │
│  RAM               │  ~100ns    │  16-512GB │                    │
│        ▼                                                         │
│  SSD               │  ~16μs     │  TB       │                    │
│        ▼                                                         │
│  HDD               │  ~2ms      │  TB       │  Slowest           │
│                                                                  │
└──────────────────────────────────────────────────────────────────┘

If L1 cache access = 1 second (human scale):
- L2 cache = 4 seconds
- L3 cache = 12 seconds
- RAM = 1.5 minutes
- SSD = 4.4 hours
- HDD = 23 days

A PAGE FAULT (going to disk) is like waiting 23 DAYS vs 1.5 MINUTES!
Why this matters: If your process is swapping (accessing disk), it's 10,000x slower than accessing RAM. This is why understanding memory management is critical for performance. I've seen systems where swapping caused 100x performance degradation.
Page Faults: When the Illusion Breaks
What Happens During a Page Fault
1. Process accesses virtual address 0x12345678
                    │
                    ▼
2. CPU checks page table → Page not in RAM!
                    │
                    ▼
3. CPU raises PAGE FAULT exception
                    │
                    ▼
4. OS page fault handler runs:
   ┌─────────────────────────────────────────┐
   │ a) Find the page on disk (swap/file)    │
   │ b) Find free RAM frame (maybe evict)    │
   │ c) Load page from disk into RAM         │
   │ d) Update page table                    │
   │ e) Resume the process                   │
   └─────────────────────────────────────────┘
                    │
                    ▼
5. Process continues, unaware of the ~10ms delay
Types of Page Faults
| Type | Cause | Cost | Example |
|---|---|---|---|
| Minor | Page in memory but not mapped | ~1μs | Lazy allocation, shared libs |
| Major | Page must be loaded from disk | ~10ms | Swapped out page, file read |
Major page faults are 10,000x slower than minor!
Why this matters: If your app triggers major page faults frequently, you'll see random latency spikes. This is why understanding memory access patterns matters. I've debugged production issues where page faults caused 100ms+ latency spikes.
Common Mistakes (I've Made These)
Mistake #1: "My process uses 2GB" (Looking at VmSize)
Why it's wrong: Virtual memory ≠ physical memory. I've seen this confuse so many engineers.
VmSize: 2048000 kB  ← This is what people often quote
VmRSS:   150000 kB  ← This is actual physical memory used!
A process can map 2GB but only touch 150MB. The OS only allocates physical memory when you actually use it (lazy allocation).
Right approach: Look at RSS (Resident Set Size) for actual usage. This is what matters for performance and OOM kills.
Mistake #2: "Adding more RAM will help"
Why it's wrong: If your working set fits in RAM, more RAM won't help. I've wasted money on this.
Diagnostic:
# Check major page faults
cat /proc/<PID>/stat | awk '{print $12}'  # majflt field

# If near zero, RAM isn't your bottleneck!
Right approach: Profile first. More RAM only helps if you're actually memory-constrained. Check page faults, not just memory usage.
Mistake #3: "Memory leaks cause OOM"
Why it's wrong: Most "leaks" are actually memory bloat - keeping references you don't need. True leaks (allocating without freeing) are rarer.
Right approach:
- Use heap profilers (py-spy for Python, async-profiler for Java)
- Look at what's keeping objects alive (not just what's allocated)
- Check for growing collections (caches without eviction)
Trade-offs: Memory Management Decisions
Trade-off #1: Swap Space
With Swap:
- ✅ System stays up under memory pressure
- ✅ Rarely-used pages can be evicted
- ❌ Severe performance degradation when swapping (10,000x slower)
- ❌ "Swap death" - system becomes unresponsive
Without Swap:
- ✅ Predictable performance (no swap thrashing)
- ✅ OOM killer acts quickly (better than slow death)
- ❌ Less memory flexibility
- ❌ Sudden death instead of slow death
Recommendation:
- Production servers: Small swap (1-2GB) as emergency buffer
- Containers: Often run without swap (cgroups handle limits)
- Development: Larger swap is fine
- Latency-sensitive apps: No swap - you want predictable performance
Trade-off #2: Virtual Memory Overcommit
What is overcommit? Linux allows processes to allocate more virtual memory than physical RAM exists. This works because most processes don't touch all their allocated memory. But if everyone tries to use it at once, the OOM killer steps in.
Conservative (overcommit_memory=2):     Aggressive (overcommit_memory=0):
- Never OOM-killed                      - Run more processes
- Predictable behavior                  - Memory-efficient
- Wasted memory                         - OOM killer risk
- malloc() can fail                     - Unpredictable under pressure

Use for: Trading systems, Databases    Use for: Web servers, batch jobs
Code Examples (The Lazy Allocation Demo)
Understanding Memory Allocation
This demonstrates why malloc(1GB) returns instantly:
import os

def show_memory():
    """Show current process memory usage"""
    with open('/proc/self/status', 'r') as f:
        for line in f:
            if line.startswith(('VmSize', 'VmRSS', 'VmSwap')):
                print(line.strip())

def demonstrate_lazy_allocation():
    """Show that malloc doesn't actually allocate physical memory"""
    print("=== Before allocation ===")
    show_memory()

    # "Allocate" 500MB - this is just virtual address space!
    size = 500 * 1024 * 1024  # 500MB
    data = bytearray(size)  # Virtual memory allocated

    print("\n=== After allocation (before touching) ===")
    show_memory()
    # Notice: VmSize increased, but VmRSS barely changed!

    # Now actually touch the memory (trigger page faults)
    print("\n=== Touching every page... ===")
    for i in range(0, size, 4096):  # Touch every 4KB page
        data[i] = 1

    print("\n=== After touching all pages ===")
    show_memory()
    # Now VmRSS matches VmSize - physical memory allocated!

demonstrate_lazy_allocation()
Key insight: malloc() or bytearray() returns instantly because it only allocates virtual memory. Physical memory is allocated lazily when you actually touch the pages (page faults). This is why you can "allocate" 1GB instantly, but accessing it can be slow if it triggers page faults.
Monitoring Page Faults
import resource

def show_page_faults():
    usage = resource.getrusage(resource.RUSAGE_SELF)
    print(f"Minor faults (no I/O): {usage.ru_minflt}")
    print(f"Major faults (disk I/O): {usage.ru_majflt}")

print("Initial page faults:")
show_page_faults()

# Allocate and touch memory
data = bytearray(100 * 1024 * 1024)  # 100MB
for i in range(0, len(data), 4096):
    data[i] = 1

print("\nAfter touching 100MB:")
show_page_faults()

# Major faults would indicate swapping - bad for performance!
Real-World Trade-off Stories
RavenDB: The Guinness Record for Page Faults
Situation: A RavenDB customer experienced extreme CPU spikes (100% utilization) with hundreds of thousands of page faults per second. This created a cascading failure across their entire cluster.
What happened:
- The system was experiencing massive page fault activity
- RAM, disk I/O, and CPU resources were all heavily taxed simultaneously
- This created a worst-case performance scenario called "thrashing"
- The system became effectively unusable
Root cause: Heavy page fault activity occurs when the system is constantly swapping pages between RAM and disk. This happens when memory pressure is high and the working set doesn't fit in RAM.
Lesson: Page faults can cause severe production issues. Monitor page fault rates—if they're consistently high, you have a memory pressure problem. According to Microsoft's performance team, if paging activity exceeds 70% of total disk I/O consistently, investigate immediately.
References:
- RavenDB: Production Postmortem - The Guinness Record for Page Faults
- Microsoft: The Basics of Page Faults
Java Trading System: GC + Swap = Catastrophic Latency
Situation: A high-frequency trading system using Java had random 100ms+ latency spikes. For trading systems, 100ms is catastrophic—you lose money.
Investigation:
- GC was running frequently
- Some GC cycles took much longer than others (100ms+ vs normal 5ms)
- Correlation: Long GCs when accessing cold heap pages
Root cause:
- JVM heap was 32GB
- System had 64GB RAM, but also ran other processes
- Cold heap pages were swapped out to disk
- When GC ran, it touched all pages → Major page faults → 100ms+ delays
The numbers: Research on swap-aware GC policies found that collecting 10 GiB of swapped data took 671 seconds versus 190 seconds with optimized policies. The default Parallel-Compact GC moves non-GC target data to reduce fragmentation, continuously swapping data between disk and memory, causing massive page fault overhead.
Fix:
# Lock JVM heap in physical memory
java -XX:+AlwaysPreTouch -XX:+UseLargePages ...

# Or disable swap entirely for latency-sensitive systems
Lesson: GC + Swap is a deadly combination for latency-sensitive systems. For trading systems, online gaming, or any app where 200ms is the maximum tolerable latency, disable swap and lock critical memory in RAM.
References:
Elasticsearch: The 32GB Heap Sweet Spot
Situation: You'd think larger heap = more cache = better performance, right? Wrong. Elasticsearch learned this the hard way.
The problem:
- Heap > 32GB loses compressed object pointers (CompressedOops)
- This JVM optimization reduces memory overhead by compressing object pointers
- Once you exceed 32GB, this optimization is disabled
- Effectively: 32GB heap can address MORE objects than 40GB heap
- GC pauses also increase with heap size
The numbers: Elasticsearch doesn't recommend setting JVM heap memory above 32GB. The performance impact from disabling CompressedOops can be significant, though exact numbers vary.
Recommendation from Elasticsearch:
- Never exceed 50% of RAM for JVM heap
- Stay under 32GB to keep CompressedOops
- Leave room for OS page cache (this is critical!)
Good: 64GB RAM → 30GB heap, 34GB for OS cache
Bad:  64GB RAM → 60GB heap, 4GB for OS cache
Production best practices:
- Set
-Xmsand-Xmxto no more than 50% of total available system memory - Monitor JVM memory pressure (not just heap usage) - it better represents node responsiveness
- Take action if JVM memory pressure consistently exceeds 85%
References:
- Elasticsearch: A Heap of Trouble - Managing Elasticsearch's Managed Heap
- Elasticsearch: JVM Settings Documentation
- Elasticsearch Discuss: What happens when you go over 32GiB?
Lesson: More memory isn't always better. Understanding your runtime's memory model (like CompressedOops) is critical. Sometimes less is more.
Common Confusions (Cleared Up)
"Virtual memory is the same as swap!"
Reality: Virtual memory is the abstraction (every process gets its own address space). Swap is disk storage used when RAM is full. They're related but different:
- Virtual memory: Always exists (even without swap)
- Swap: Optional disk space for when RAM is full
"More virtual memory = more performance!"
Reality: Virtual memory is just an address space. What matters is:
- RSS (Resident Set Size): How much is actually in RAM
- Page faults: How often you're going to disk
A process with 10GB virtual memory but 100MB RSS is fine. A process with 2GB virtual memory but 1.5GB RSS might be swapping.
"malloc() allocates physical memory immediately!"
Reality: malloc() only allocates virtual memory. Physical memory is allocated lazily when you touch the pages (lazy allocation). This is why malloc(1GB) returns instantly but accessing it can be slow.
"If I have swap, I can't run out of memory!"
Reality: Swap prevents OOM-kills but causes severe performance degradation. If you're actively swapping, your system is effectively broken. Better to OOM-kill one process than have everything slow to a crawl.
Debugging Memory Issues
The Three Numbers You Must Know
# Check these for any process
cat /proc/<PID>/status | grep -E "^(VmSize|VmRSS|VmSwap)"

VmSize:  Total virtual memory (what process thinks it has)
VmRSS:   Resident Set Size (what's actually in RAM - THIS MATTERS!)
VmSwap:  How much is swapped out (should be ~0 in production)

# If VmSwap > 0, you have a problem!
System-Wide Memory Check
# Quick overview
free -h

              total        used        free      shared  buff/cache   available
Mem:           62Gi        24Gi       1.2Gi       1.0Gi        36Gi        35Gi
Swap:         2.0Gi       500Mi       1.5Gi

# What matters:
# - 'available' = how much can be used (including reclaimable cache)
# - 'buff/cache' = disk cache (good! can be reclaimed)
# - Swap used > 0 = investigate!
Finding Memory Hogs
# Top memory consumers
ps aux --sort=-%mem | head -10

# Memory usage by process name
ps -eo pid,comm,rss --sort=-rss | head -20

# Watch for swapping in real-time
vmstat 1
# Look at 'si' (swap in) and 'so' (swap out) columns
# Non-zero = active swapping = performance problem
Decision Framework: Memory Configuration
□ What's the working set size of my application?
  → Measure RSS under normal load
  → Ensure RAM > working set + OS needs

□ Should I use swap?
  → Production servers: Small swap (1-2GB) as safety net
  → Latency-sensitive: Consider no swap
  → Development: Larger swap is fine

□ How should I set memory limits (containers/cgroups)?
  → limit = expected RSS + 20% headroom
  → Don't set limit = total RAM (leave room for OS)

□ What memory overcommit policy?
  → Mission-critical: Conservative (overcommit_memory=2)
  → General servers: Default heuristic (overcommit_memory=0)
Memory Trick
"VRSS" - What to check:
- Virtual: What the process thinks it has (VmSize)
- Resident: What's actually in RAM (RSS - this matters!)
- Shared: Memory shared with other processes
- Swap: What got kicked to disk (bad if high)
Self-Assessment
Before moving on, make sure you can:
- [ ] Explain why
malloc(1GB)returns instantly but accessing it is slow - [ ] Identify the difference between minor and major page faults
- [ ] Diagnose memory pressure from
free -houtput - [ ] Know why GC + swap is a dangerous combination
- [ ] Explain the difference between VmSize and RSS
- [ ] Understand why Elasticsearch recommends staying under 32GB heap
Key Takeaways
- Virtual ≠ Physical: VmSize is not your actual memory usage; RSS is
- Page faults matter: Major faults (disk access) are 10,000x slower
- Measure before optimizing: More RAM only helps if you're actually constrained
- Swap is a trade-off: Prevents OOM but causes severe slowdowns
- Memory bloat ≠ Memory leak: Most issues are from keeping references, not forgetting to free
- GC + Swap = Disaster: For latency-sensitive systems, disable swap and lock memory
What's Next
Now that you understand how memory works, the next question is: How does data actually get written to disk?
In the next article, File I/O & Durability - Why fsync() Is Your Best Friend (And Worst Enemy), you'll learn:
- Why your data might be lost even after
write()returns (this has bitten me) - How the OS buffers writes for performance (using that page cache you just learned about!)
- When to use
fsync()and when to avoid it - The trade-offs between durability and performance
This connects directly to memory management—data flows from your process's memory, through the OS page cache (from Article 2), to disk. Understanding this path is critical for building durable systems.
→ Continue to Article 3: File I/O & Durability
This article is part of the Backend Engineering Mastery series. Each article builds on the previous—you learned about process isolation in Article 1, and now you understand how memory works within those processes.